FTC Affiliate Disclosure: This article contains affiliate links. We may earn a commission if you make a purchase through these links, at no additional cost to you.
This straightforward guide explains common dashboard layouts and design elements in at-home lab test results. It focuses solely on navigation and presentation—not on interpreting results medically. Always consult a licensed healthcare provider for personalized insights.
What You’ll Typically Receive
When your sample is processed, most companies notify you via email or app and provide access to:
- A summary overview – Often with visual highlights for quick scanning.
- A detailed list of tested items – Biomarkers, hormones, nutrients, or reactivity levels, depending on the kit.
- Reference indicators – Such as ranges, classes, or flags defined by the manufacturer.
- A downloadable PDF – Ideal for printing or sharing with your provider.
Many platforms, like Everlywell and Function Health, include trend tracking for repeat tests.
Step 1: Understanding Color Indicators
Many dashboards use color-coding (often a traffic-light system) to organize information visually. These are manufacturer-defined and informational only.
|
Color |
Common Manufacturer Meaning |
|
Green |
Typically within the company’s normal range |
|
Yellow/Orange |
Often flagged for monitoring or borderline |
|
Red |
Frequently indicates elevated or out-of-range values |
Example from food sensitivity panels: Foods may appear in green (low reactivity), yellow (moderate), or red (high).
These colors highlight categories but do not provide diagnostic meaning.
Step 2: Understanding Classes or Numerical Ranges
Food sensitivity tests commonly use IgG reactivity classes (0–3), based on manufacturer thresholds.
|
Class |
Typical Manufacturer Description |
|
0 |
Normal or low reactivity |
|
1 |
Mild elevation |
|
2 |
Moderate elevation |
|
3 |
High reactivity |
Example: A food listed as “Class 3” reflects the company’s highest reactivity category.
Note: IgG levels indicate exposure, not clinical allergy or intolerance. Professional bodies advise caution in interpretation.
Step 3: Creating a Personal Reference List
Long dashboards can feel overwhelming. Many users compile a simple list of:
- Items flagged (e.g., yellow/red or higher classes).
- Biomarkers they want to discuss further.
This organizational tool helps prepare for provider conversations—it’s not dietary advice.
Step 4: Tracking Over Time (Optional)
Some platforms offer built-in trackers. Users may also keep personal notes on lifestyle factors alongside results for context when reviewing with a provider.
Step 5: Preparing for Provider Discussion
Most companies recommend sharing results with a healthcare professional. Prepare by:
- Downloading the PDF.
- Listing questions (e.g., “What does this range mean in my context?”).
- Noting any flagged items.
Common Result Examples (Dashboard Styles)
Here are typical presentations—manufacturer-specific and informational:
- Biomarker ranges (e.g., Vitamin D): Shown with bars or flags relative to reference.
- Hormone levels (e.g., Cortisol): Often graphed with optimal zones.
- IgG reactivity: Grouped by food categories with classes/colors.
Top Platforms for Clear Dashboards in 2026
Visual, user-friendly results drive high engagement. These CLIA-certified options are popular for intuitive layouts and tracking features. Affiliates often see strong conversions in wellness niches due to repeat testing.
Platform | Dashboard Highlights | Best For | Affiliate Link |
Everlywell | Color-coded results, explanations, PDF download | Broad testing (sensitivity, hormones) | Everlywell Dashboard – Popular program |
Function Health | 100+ biomarkers, physician notes, trends | Comprehensive panels | Function Health – Bundle-friendly |
InsideTracker | Personalized scores, app integration, recommendations | Ongoing tracking | InsideTracker – High conversions on subscriptions |
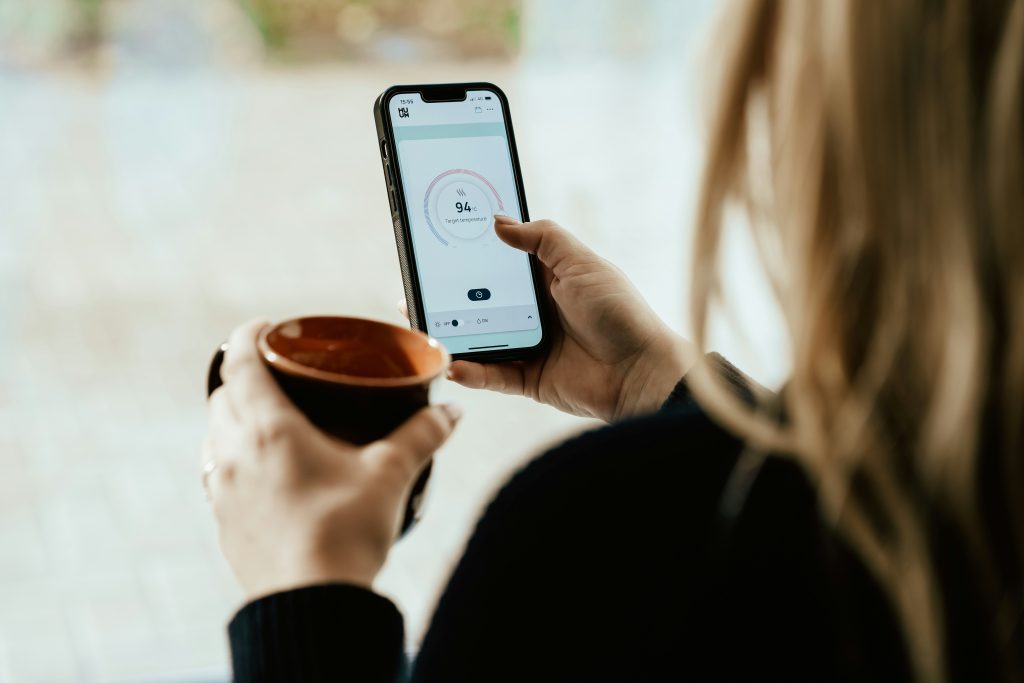
These examples showcase real dashboard visuals to help you navigate similar layouts.
FAQ
What if many items are flagged? Prioritize higher categories for your reference list, then discuss with a provider.
Can I share results with my doctor? Yes—most platforms make PDFs easy to export.
Can I retest? Many offer bundles or subscriptions for monitoring.
Something looks unclear? Contact support or consult a professional.
Key Takeaways
At-home dashboards help you:
- Navigate organized data visually.
- Spot manufacturer-flagged items.
- Prepare for informed provider discussions.
For seamless tracking, platforms like InsideTracker integrate results with lifestyle data—popular for ongoing wellness bundles.
Disclosure Reminder: This article is informational only and does not provide medical advice, diagnosis, or treatment. Consult a licensed healthcare provider. Prices/availability as of December 2025—verify official sites. Affiliate links included at no extra cost. Opinions independent.
This content is for informational purposes only and is not a substitute for professional medical advice. As an Amazon Associate, we earn from qualifying purchases. Consult a healthcare provider before starting any new supplement, especially if pregnant or on medication.
References
American Academy of Allergy, Asthma & Immunology. (2025). The myth of IgG food panel testing. Retrieved from https://www.aaaai.org/tools-for-the-public/conditions-library/allergies/igg-food-test
Everlywell. (2025). Understanding food sensitivity results. Retrieved from https://support.everlywell.com/article/174-understanding-my-results